In today’s world, we depend on the PLC to be our eyes and ears on the health of our automation machines. We depend on them to know when there has been an equipment failure or when preventative maintenance is needed. To gain this level of diagnostics, the PLC must do more work, i.e. more rungs of code are needed to monitor the diagnostics supplied to the sensors, actuators, motors, drives, etc.
In terms of handling diagnostics on a machine, I see two philosophies. First, put the bare bones minimum in the PLC. With less PLC code, the scan times are faster, and the PLC runs more efficiently. But this version comes with the high probability for longer downtime when something goes wrong due to the lack of granular diagnostics. The second option is to add lots of diagnostic features, which means a lot of code, which can lessen downtime, but may throttle throughput, since the scan time of the PLC increases.
So how can you gain a higher level of diagnostics on the machine and lessen the burden on the PLC?
While we usually can’t have our cake and eat it too, with Industry 4.0 and IIoT concepts, you can have the best of both of these scenarios. There are many viewpoints of what these terms or ideas mean, but let’s just look at what these two ideas have made available to the market to lessen the burden on our PLCs.
Data Generating Devices Using IO-Link
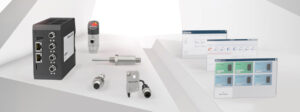
The technology of IO-Link has created an explosion of data generating devices. The level of diversity of devices, from I/O, analog, temperature, pressure, flow, etc., provides more visibility to a machine than anything we have seen so far. Utilizing these devices on a machine can greatly increase visibility of the processes. Many IO-Link masters communicate over an Ethernet-based protocol, so the availability of the IO-Link device data via JSON, OPC UA, MQTT, UDP, TCP/IP, etc., provides the diagnostics on the Ethernet “wire” where more than just the PLC can access it.
Linux-Based Controllers
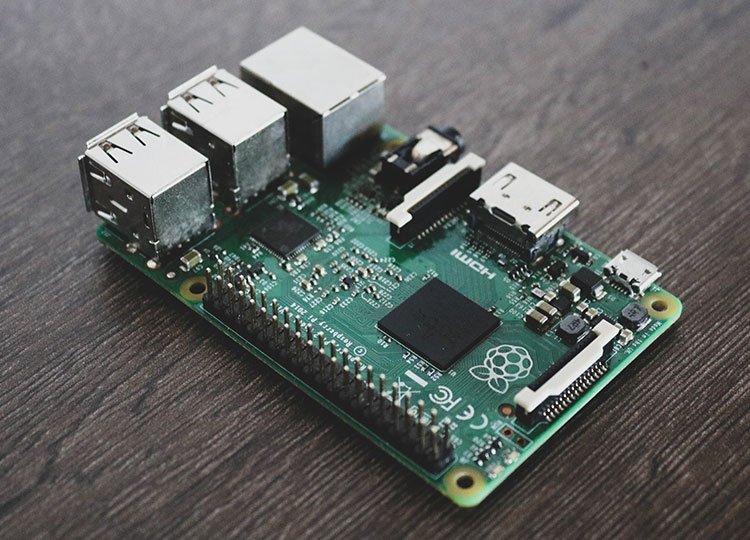
After using IO-Link to get the diagnostics on the Ethernet “wire,” we need to use some level of controller to collect it and analyze it. It isn’t unusual to hear that a Raspberry Pi is being used in industrial automation, but Linux-based “sandbox” controllers (with higher temperature, vibration, etc., standards than a Pi) are available today. These controllers can be loaded with Codesys, Python, Node-Red, etc., to provide a programming platform to utilize the diagnostics.
Visualization of Data
With IO-Link devices providing higher level diagnostic data and the Linux-based controllers collecting and analyzing the diagnostic data, how do you visualize it? We usually see expensive HMIs on the plant floors to display the diagnostic health of a machine, but by utilizing the Linux-based controllers, we now can show the diagnostic data through a simple display. Most often the price is just the display, because some programming platforms have some level of visualization. For example, Node-Red has a dashboard view, which can be easily displayed on a simple monitor. If data is collected in a server, other visualization software, such as Grafana, can be used.
To conclude, let’s not overburden the PLC with diagnostic; lets utilize IIoT and Industry 4.0 philosophy to gain visibility of our industrial automation machines. IO-Link devices can provide the data, Linux-based controllers can collect and analyze the data, and simple displays can be used to visualize the data. By using this concept, we can greatly increase scan times in the PLC, while gaining a higher level of visibility to our machine’s process to gain more uptime.
Source: AUTOMATION INSIGHTS